 |
 |
 |
 |
 |
 |
Alternative Energy
- Wind Power
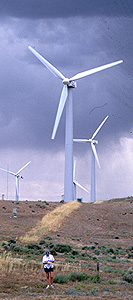
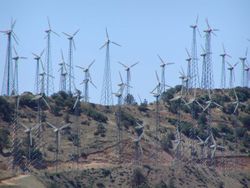
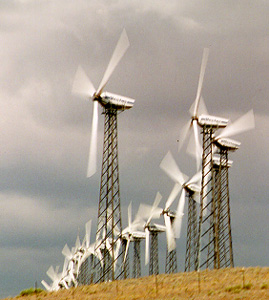
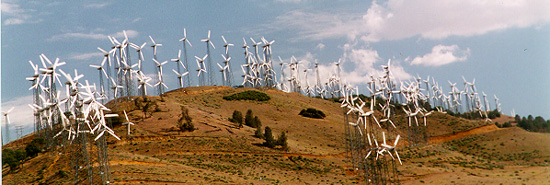
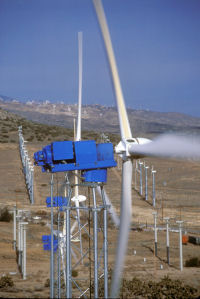
Wind Energy is very site specific. The very best wind site in the United States has long been developed at Tehachapi, CA which enjoys the combination of being in a mountain pass and the thermal differental between the Moajva Desert to the East and the Pacific Ocean to the West. Even so, as the graphs indicate below, Wind Energy is not a "reliable 24/7" energy source. KVA has on file extensive studies of studies commissioned by the CA Depaprtment of Energy that help develop deeper understandings winds likely potential. The graphs below demostrate the complexity of matching wind energy vs. demand at different points in an August's peak heat.
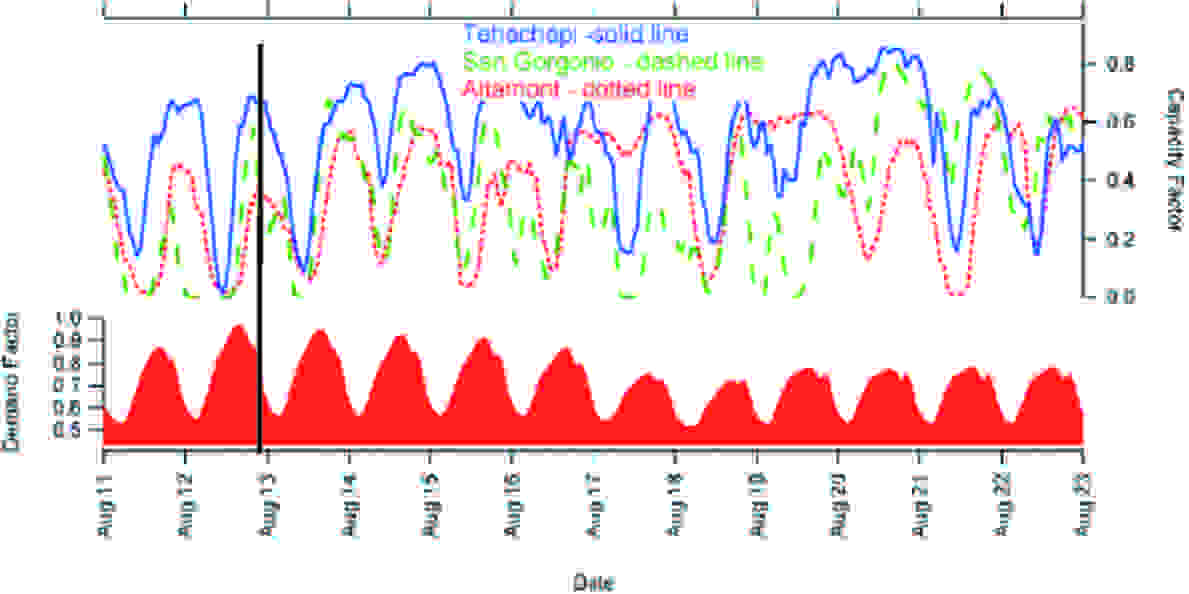 |
Demand (red) vs. Wind Energy (blue): These overlaid graphs shows that the best Wind Energy lags Demand by 4-6 hr. Maximum winds occur at night when air rushes back into the vacuum caused by the night time cooling in the Mojave Desert. It also demonstrates the variability of Wind Energy from one day to the next in a given site and between sites. (Blue Wind Energy = Tehachapi Pass NE of Los Angles; Green = San Gorgonio, a mountain pass area NE of Fresno, CA; Red = Altamont Pass, just East of San Francisco.) |
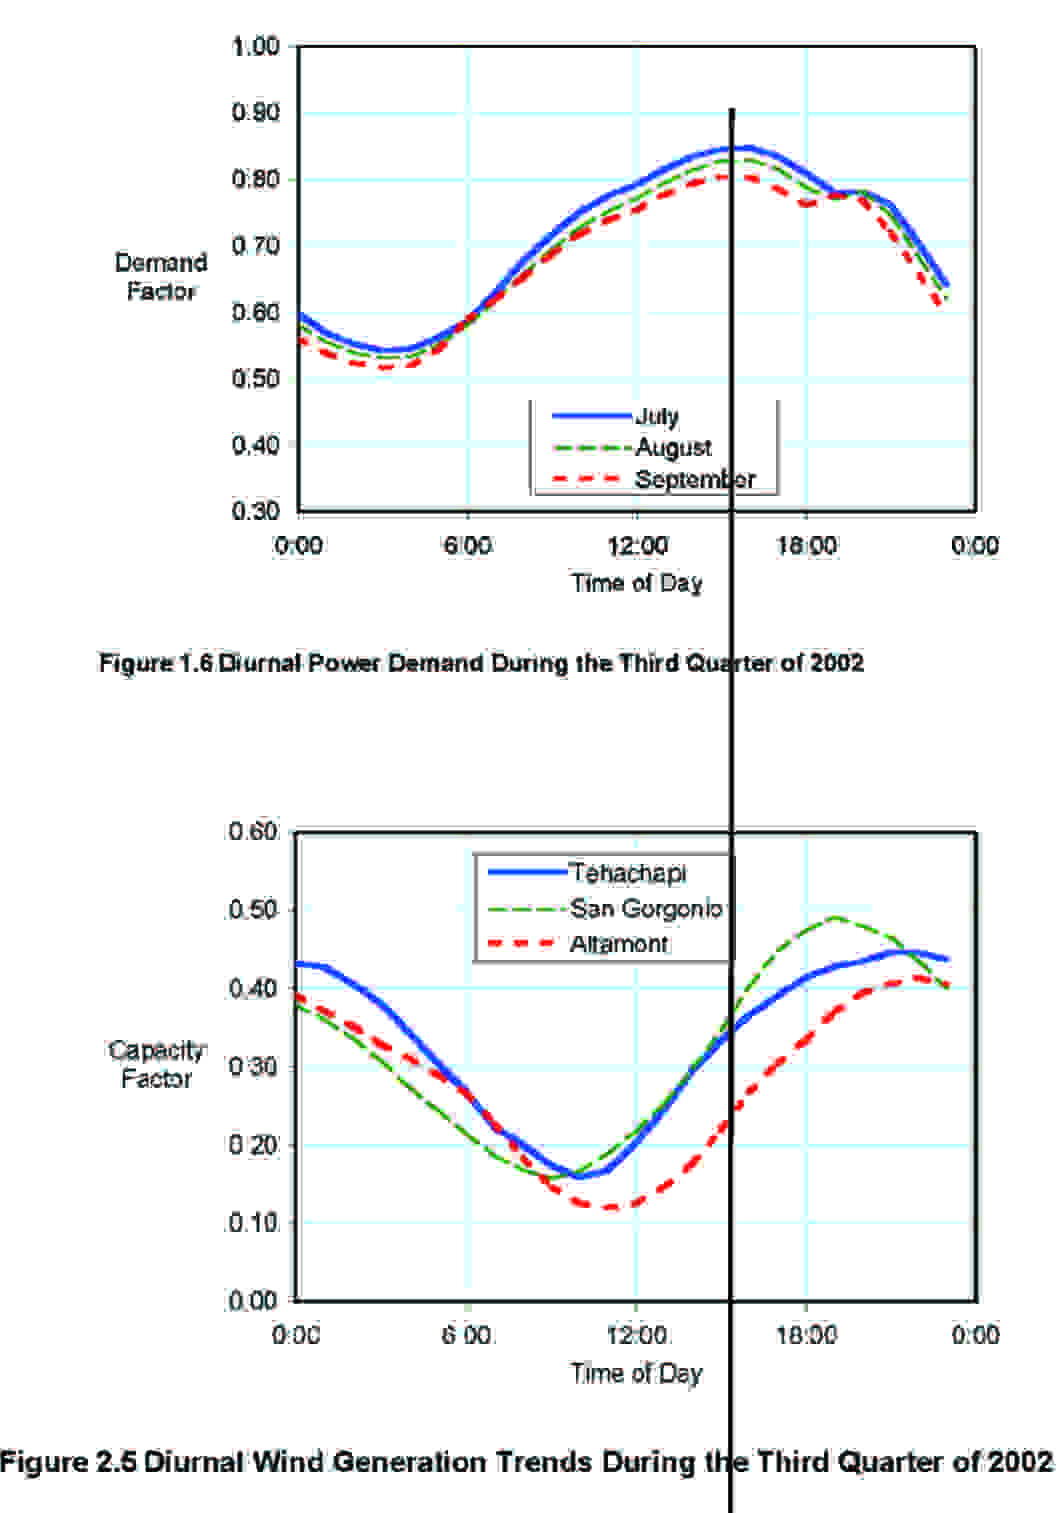 |
Avg. Energy vs. Avg. 24hr Demand: The top graph shows the average Electrical Demand per hour for the Third Quarter of 2002 throughout California month to month. The bottom graph depicts the corresponding available Wind Energy, again for the above three CA Wind Hotspots. How can this "wasted night time energy" be saved and used during the following morning when Wind Energy is at its lowest? |